
BLOG
The Sprite Artist Shortage Is Real — Here Is One Tool Closing The Gap

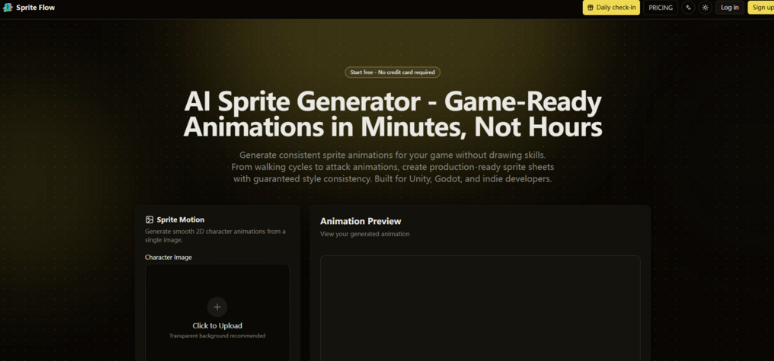
Spend any time in indie game development forums and one complaint surfaces with unusual regularity: finding a pixel artist who is available, affordable, and stylistically compatible with your project is genuinely difficult. The demand for game-ready sprite art has grown faster than the supply of artists who produce it professionally. The result is a market where solo developers either pay rates that stretch small project budgets to the breaking point, wait weeks for turnaround on assets they needed last month, or ship games with visual assets that do not represent the experience they built. The AI Sprite Generator from Sprite Flow enters this gap with a specific claim — that AI can now handle the frame-by-frame consistency problem that has historically made sprite animation resistant to automation.
That is a meaningful claim, and it deserves honest evaluation rather than either dismissal or enthusiasm. Here is what the platform actually does, where it performs well, and where it still has room to grow.
What Makes Sprite Animation Harder Than Regular Image Generation
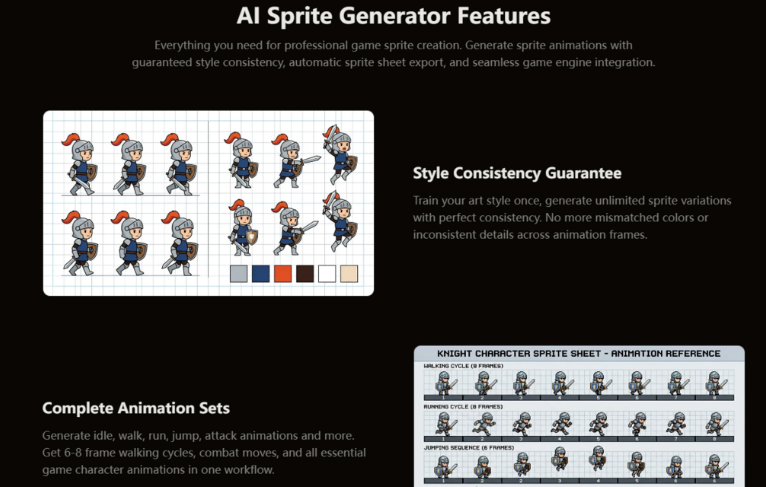
Generating a single game character illustration is a solved problem for modern AI tools. Generating a walk cycle — eight frames where that character’s proportions, palette, and visual weight remain locked while the pose changes — is a different technical challenge. The problem is not generating one good frame. It is generating eight frames that read as the same character in motion rather than eight variations of a similar character that happen to be placed in sequence.
This is why most AI image tools, despite their quality for static output, produce unreliable results for sprite animation. They optimize for single-image coherence, not cross-frame consistency. Sprite Flow’s design is organized specifically around that constraint. The platform builds a style profile from your reference images — color palette, line weight, proportional relationships — and enforces that profile across every frame it generates. The mechanism does not eliminate all inconsistency, but it addresses the root cause in a way that generic tools do not.
Step-By-Step: What The Platform Actually Asks You To Do
Step 1: Build Your Character Reference
Why reference image quality determines output quality
You begin by uploading a character image or describing one through a text prompt. The platform recommends a transparent or clean background on uploaded images. The reasoning is practical: background elements introduce color and texture signals that can interfere with the palette extraction the system uses to anchor style. A character cleanly isolated on transparency gives the system accurate data about what your character actually looks like versus what surrounds them.
If you are working from a text description rather than an image, specificity matters considerably. General descriptions like “a warrior in armor” produce generic output. Descriptions that specify silhouette characteristics, color relationships, and art style references — “a stocky 16-bit style knight with cobalt blue plate armor, visible rivets, and a rounded helmet with a yellow visor slit” — give the system enough to work from. The system’s style locking is only as precise as the anchor you provide it.
Step 2: Select Animation Parameters and Generate
Understanding what the frame count and speed settings control
After establishing the character, you choose an animation category from the available set — idle, walk, run, jump, various attack types, hit reaction, death, roll, climb, and others — then set frame count and playback speed. Frame count typically runs from six to twelve frames depending on animation complexity. Playback speed ranges from eight frames per second for retro pixel art feel to twenty-four frames per second for smoother modern 2D motion.
The AI Sprite Generator then generates the full frame sequence, returning a looping preview within approximately sixty seconds. You evaluate the preview for style consistency and motion quality. If the output meets your requirements, you proceed to export. If not, you can regenerate — the sixty-second cycle makes iteration practical rather than painful.
Step 3: Export With Engine Metadata Included
What each engine export package contains
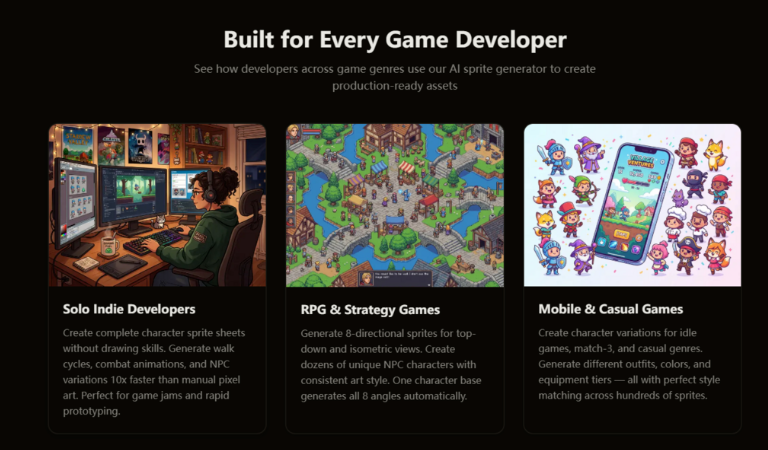
The export step is where the platform’s practical orientation shows most clearly. Rather than delivering a flat sprite sheet and leaving engine configuration to you, Sprite Flow bundles engine-specific metadata with the output. Unity exports include the sprite sheet atlas, JSON frame data, and animation controller presets. Godot exports produce AnimatedSprite resource files with pre-configured frame timing. Unreal exports follow Paper2D flipbook conventions. You can also export individual PNG frames or standard JSON sprite atlas format for other engines or tools.
Manual sprite sheet configuration is one of those tasks that sounds minor until you have done it for twenty characters across five animation states each. Having that work handled in the export layer is a compounding time savings across a full game’s worth of assets.
Real Scenarios Where This Changes The Math
The Game Jam Crunch
A forty-eight-hour game jam does not leave time for a twenty-hour sprite workflow. It barely leaves time for a two-hour sprite workflow. In jam conditions, Sprite Flow’s speed becomes its primary value — a character with a core animation set can be in your engine within thirty minutes of starting the process. The visual quality will not match a polished hand-crafted sprite, but it will be visually coherent and animation-ready, which is what a game jam submission actually needs.
The Prototype Treadmill
Early game development involves testing many ideas quickly and discarding most of them. Committing significant art resources to a mechanic that might not survive the next design review is a poor allocation of limited time. Sprite Flow fits naturally into a prototype workflow where the goal is proving out a game feel rather than producing final assets. Generate functional sprites, test the concept, and invest in polished art only for the ideas that survive iteration.
The NPC Population Problem
Open-world and RPG games need populated environments, which means large numbers of visually distinct characters sharing a consistent aesthetic. Producing those at scale manually is one of the most time-intensive tasks in game development. Once a visual style is established in Sprite Flow, generating variations — different silhouettes, different equipment, different roles — becomes a production task rather than an art task. The style locking mechanism is what makes this viable; without it, variations drift visually in ways that undermine the coherent world you are trying to build.
Honest Assessment: Where The Output Is Not Ready To Ship
Style inconsistency across frames is the most common issue in practice. Complex character designs — layered armor, multi-element weapons, characters with non-standard proportions — introduce more variation between frames than simpler designs. Characters with strong, clear silhouettes consistently outperform intricate designs in output stability.
Prompt interpretation is another variable. The system handles direct, concrete descriptions better than abstract or stylistic language. If your reference images are ambiguous — low resolution, multiple characters in frame, cluttered backgrounds — the extracted style parameters will reflect that ambiguity in the output.
The platform is also not a single-pass solution for hero characters or central game assets where animation quality is a core part of the experience. For those characters, AI-generated output typically serves better as a foundation for manual refinement in Aseprite or a comparable tool than as a final deliverable. Using Sprite Flow for secondary characters and environment NPCs while reserving manual art effort for protagonist and boss characters is a more realistic production strategy than expecting consistent polish across all character types.
Comparing The Options Developers Actually Have
| Factor | Asset Store Packs | Freelance Artist | Manual Pixel Art | Sprite Flow |
| Production speed | Immediate | 1–2 weeks per asset | 20–40 hours per character | ~20 minutes per character |
| Visual uniqueness | Generic | Fully custom | Fully custom | Custom per project |
| Cross-character consistency | Fixed by pack | Depends on artist brief | High but slow | AI-enforced via style locking |
| No-art-skill accessible | Yes | Yes | No | Yes |
| Engine export overhead | Varies | Manual setup required | Manual setup required | Metadata bundled |
| Iteration speed | None | Slow and costly | Slow | Fast |
| Suitable for NPC scale | If pack matches | Budget-prohibitive | Time-prohibitive | Designed for this |
Who Gets Real Value Here Versus Who Should Look Elsewhere
The platform makes the clearest case for solo developers, small teams, and developers with programming backgrounds and limited art skills. The workflow is accessible without art training, the output is engine-ready by design, and the speed is meaningful in contexts where art production is a bottleneck.
Developers with strong pixel art skills who primarily need to move faster on secondary assets — rather than replace their art process entirely — will also find the tool useful as a production accelerator rather than a complete replacement for manual work.
Where Sprite Flow is less compelling is for projects where animation fidelity is a primary design value and hero characters need frame-perfect quality throughout. In that context, the tool serves better as a starting point for manual refinement than as an end-to-end solution.
The free tier provides enough credit to complete real test runs across different character types and animation categories — enough to form an honest opinion about whether the output quality fits your specific project before any commitment to a paid plan.


Erectn is an unusual term that can attract attention because of its unfamiliar spelling and the questions it creates for people searching online. When users encounter a word like Erectn, they may wonder whether it is a name, abbreviation, typo, username, brand, or a variation of a more familiar expression. In today’s search-driven world, even a short and seemingly incomplete term can become a recognizable online query.
The internet has changed the way people interact with language. Search engines process billions of queries, including carefully written questions, accidental misspellings, shortened words, and unfamiliar combinations of letters. This makes terms such as Erectn interesting from both a linguistic and digital perspective.
What Does Erectn Mean?
Erectn does not immediately resemble a standard English word, which makes its interpretation dependent on context. A person encountering the term without additional information may not know what it represents. That uncertainty is precisely what can encourage further searches.
Some unusual search terms originate from typing mistakes. Others may be shortened versions of longer words or names. In some cases, a sequence of letters can become associated with a website, account, product, online profile, or other digital reference.
For that reason, it is important not to assign a definite meaning to an unfamiliar term without supporting context. The meaning of Erectn may vary depending on where it appears and how people use it.
Why Erectn Appears in Online Searches
Search behavior is not always predictable. People frequently enter words exactly as they see them, even when the spelling seems unusual. A term can therefore develop its own search presence simply because multiple users encounter it and want to learn more.
Erectn and Search Intent
Search intent describes the reason behind a person’s query. Someone searching for an unfamiliar term could be looking for a definition, a person, a website, an account, or an explanation of where the word originated.
Understanding this intent is especially useful for unusual keywords. Unlike broad commercial terms, obscure queries often represent curiosity. The searcher may simply want to understand what they have encountered.
Erectn as an Unfamiliar Digital Term
Digital environments produce new terminology constantly. Usernames, domain names, abbreviations, autogenerated labels, and shortened expressions can all create combinations that were not commonly used before.
An unfamiliar term does not necessarily need a traditional dictionary definition to become searchable. Once it appears on a webpage or digital platform, search engines can index it, and users can begin searching for it.
The Role of Spelling in Search
Spelling has always influenced communication, but its importance becomes even more visible online. A single missing letter can transform a familiar word into something that looks entirely different.
Search engines have become increasingly capable of understanding likely spelling variations. When someone enters an unusual query, a search engine may recognize a possible intended word and provide related results. However, the original spelling can still remain important because users may continue searching for exactly what they encountered.
This creates an interesting relationship between language and technology. A spelling variation can exist independently as a search query even when it does not have an established dictionary meaning.
How People Discover Terms Like Erectn
There are many ways an unusual word can reach an audience. Someone might see it on a social media profile, encounter it in a comment, notice it in a URL, or find it within an online document.
Social Media and Online Profiles
Social platforms contain millions of usernames and profile identifiers. These names are often created from personal preferences, abbreviations, random combinations, or variations of existing words.
If a particular identifier is shared publicly, other users may search for it to find the associated profile or understand its origin. Over time, repeated searches can give an otherwise obscure term greater visibility.
Websites and Digital Content
Websites are another major source of unfamiliar terminology. A word can appear in a page title, article, category, image description, or URL. Once indexed, that term can become discoverable through search engines.
This is one reason seemingly random keywords occasionally develop measurable search activity. Their visibility may come from a specific digital reference rather than from traditional language usage.
Erectn and the Evolution of Online Language
The internet has created an environment where language changes quickly. New words can emerge from communities, technology, entertainment, branding, and social media. At the same time, existing words can be shortened, modified, or combined to create new expressions.
Erectn represents the type of term that encourages people to think about how language works in a digital environment. Its value as a search query does not necessarily depend on having a conventional definition.
Search engines have effectively become part of modern language discovery. Instead of consulting only dictionaries, people now use search platforms to investigate words they have never encountered before.
Why Context Matters
Context is essential when researching an unfamiliar keyword. Looking at where a term appears can provide clues about what it represents.
For example, a word found next to a person’s name may be a username or identifier. If it appears on a website, it could relate to a page, service, category, or brand. If it appears in a sentence, it may simply be a spelling variation.
Erectn Requires Careful Interpretation
It is easy to make assumptions about an unusual word based only on how it looks. However, visual similarity does not always establish a relationship between two terms.
A responsible explanation should separate confirmed information from possibilities. When there is insufficient evidence, it is better to describe a term as uncertain rather than present an unsupported interpretation as fact.
This approach is particularly important for obscure keywords because a small amount of information can easily lead to inaccurate conclusions.
The SEO Value of Unusual Keywords
From an SEO perspective, unusual queries can be fascinating. Highly specific keywords may have less competition than broad topics, although their search volume can also be limited.
Content created around an obscure query should still provide genuine value. Simply repeating the keyword throughout a page does not create a useful article. Search engines increasingly focus on relevance, helpfulness, context, and the overall quality of content.
A strong article should explain the available information naturally while addressing the questions a reader is likely to have. Keyword placement matters, but readability should remain the priority.
Erectn in the Broader Search Landscape
The growing importance of search means that almost any recognizable sequence of characters can become an object of curiosity. People search for names, usernames, abbreviations, misspellings, phrases, and newly created expressions every day.
This makes unusual terms valuable examples of the relationship between human curiosity and digital technology. A person sees something unfamiliar, enters it into a search box, and expects technology to provide an explanation.
That process may seem simple, but it demonstrates how modern search behavior continuously shapes online language.
Conclusion
Erectn is an example of an unfamiliar term that raises questions about spelling, context, search behavior, and digital identity. Without reliable context, it would be difficult to attach one definitive meaning to the word. Its interest comes largely from the uncertainty surrounding its appearance and the reasons people may search for it.
As the internet continues to evolve, unusual terms will remain part of the digital landscape. Misspellings, abbreviations, usernames, and newly created expressions can all become searchable entities. Understanding these terms requires curiosity, context, and a willingness to distinguish verified information from speculation.
Ultimately, the story behind an unfamiliar keyword is not always about discovering a single definition. Sometimes, it is about understanding how people communicate, search, and create meaning in an increasingly digital world.
Frequently Asked Questions About Erectn
1. What is Erectn?
Erectn is an unfamiliar online term whose meaning depends on the context in which it appears.
2. Is Erectn a standard English word?
It does not appear to be a commonly recognized standard English word, so additional context is needed to determine its intended use.
3. Why might people search for Erectn?
People may search for it after seeing the term on a website, social media platform, profile, or another digital source.
4. Could Erectn be a spelling variation?
It could potentially be a spelling variation or shortened form, but its exact origin cannot be established without reliable context.
5. Can an unusual term become an SEO keyword?
Yes. Any term that people search for can potentially function as a search keyword, although its volume and competition may vary.
6. Why is context important when researching Erectn?
Context helps distinguish whether the term refers to a name, identifier, spelling variation, website, or another type of digital reference.
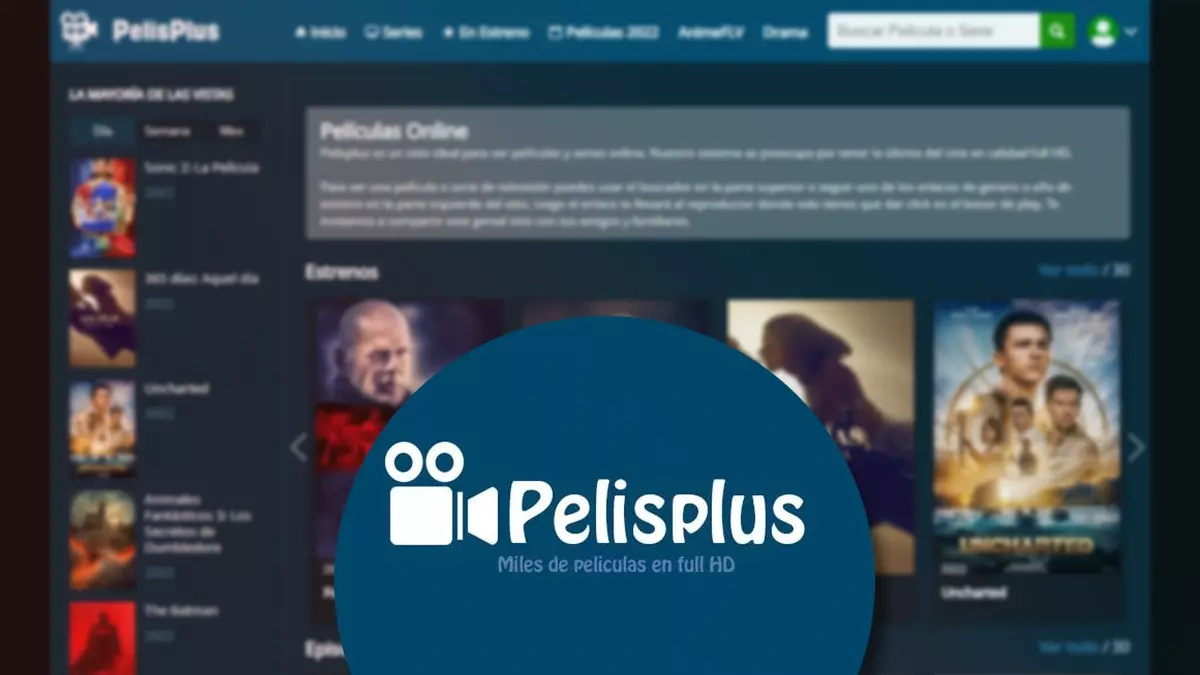
Pelisplus is a name that has become familiar within online movie culture, particularly among people who search the web for digital entertainment and Spanish-language film content. Like many internet-based entertainment names, it can attract attention because it is closely associated with the way modern audiences look for movies and television programs online. Understanding why the term appears in searches also provides a broader look at changing viewing habits, streaming expectations, and the growing role of search engines in entertainment discovery.
What Is Pelisplus?
Pelisplus is commonly associated online with movie and television content, especially Spanish-language searches. The name itself combines “pelis,” an informal Spanish shortening of “películas,” with “plus,” a word frequently used by digital brands to suggest additional content or expanded access.
That simple naming structure makes the term easy to remember. It also reflects a broader trend across the internet, where entertainment platforms often choose short, descriptive names that immediately communicate their connection to movies, series, or streaming.
However, a name appearing prominently in online searches does not automatically establish the legal status, ownership, or legitimacy of every website using that name. Internet users should always distinguish between a recognizable search term and a verified entertainment service.
Why Pelisplus Became an Online Search Term
The popularity of movie-related searches has changed considerably over the past decade. People no longer rely exclusively on television schedules, physical media, or cinema listings to decide what they want to watch. Search engines now play an important role in helping audiences identify movies, actors, genres, release information, and viewing options.
Pelisplus fits into this wider search behavior. Someone may encounter the term while looking for a particular film, exploring Spanish-language entertainment, or comparing different ways to watch a program.
Search behavior can also be influenced by social media, online recommendations, and word-of-mouth discussions. Once a name becomes familiar to a particular audience, people may continue searching for it even when the services or websites associated with that name change over time.
Pelisplus and Spanish-Language Entertainment
One of the most interesting aspects of Pelisplus is its connection with Spanish-language entertainment searches. Spanish-speaking audiences represent a large and diverse digital community spread across Latin America, Spain, the United States, and other parts of the world.
For these audiences, online entertainment is not limited to Hollywood productions. Spanish-language movies, television series, Mexican productions, Spanish dramas, Argentine films, and other regional content all contribute to a large international entertainment ecosystem.
This creates strong demand for websites, databases, streaming services, and search platforms that make Spanish-language content easier to discover. A name such as Pelisplus can therefore become recognizable because it appears within a much larger ecosystem of Spanish-language movie searches.
How Online Movie Culture Has Changed
To understand the interest surrounding Pelisplus, it helps to look at the evolution of online movie culture.
In the past, viewers often planned their entertainment around fixed television schedules. If a favorite movie was broadcast at a particular time, viewers had to be available then. Cable television expanded the number of available channels, but programming was still controlled by broadcasters.
Streaming introduced a different model.
Instead of waiting for a scheduled broadcast, viewers increasingly expect entertainment to be available whenever they want it. This shift has influenced everything from television production to movie marketing. Audiences now search for titles directly, read reviews, watch trailers, and decide what to view based on recommendations.
The result is an entertainment culture built around convenience and discovery rather than fixed schedules.
Pelisplus and the Search for Convenient Viewing
Convenience is one of the strongest forces shaping online entertainment. People want simple ways to discover content without spending excessive time navigating complicated menus.
Search engines have become an important part of that process. A user may type the name of a movie followed by words such as “watch,” “stream,” “online,” or “Spanish.” This behavior creates visibility for many entertainment-related names and websites.
Pelisplus is part of this broader search phenomenon. Its appearance in search results reflects the continued demand for straightforward movie discovery, particularly among users interested in Spanish-language content.
At the same time, convenience should not replace caution. Users should check whether a platform is authorized to distribute the content it offers and should be careful with unfamiliar websites, aggressive advertisements, suspicious downloads, and requests for unnecessary personal information.
Is Pelisplus an Official Streaming Platform?
The answer depends on the specific website or service being discussed. Internet names can be reused, copied, or associated with different domains over time. A familiar brand name alone is therefore not enough to confirm that a particular website is official or authorized.
This is an important distinction for anyone searching for online movies.
Legitimate streaming platforms generally provide information about their company, content licensing, privacy policies, terms of service, and available subscription options. Users should look for these details before providing payment information or downloading anything.
When a website makes unusually broad claims about access to copyrighted movies without clearly explaining its licensing arrangements, visitors should exercise additional caution.
Why Movie Search Keywords Matter
Pelisplus also demonstrates how powerful entertainment-related search keywords can become. When thousands of people search for a particular term, that keyword can develop its own online identity.
Search trends often emerge from a combination of factors. A memorable brand name, popular movie releases, social media discussions, changing streaming availability, and regional entertainment preferences can all influence search volume.
For publishers and entertainment writers, these search patterns reveal something important: audiences are not only searching for movies themselves. They are also searching for ways to discover, understand, and access entertainment.
This has created an entire digital ecosystem around movie-related information.
The Importance of Safe Online Viewing
Anyone searching for Pelisplus or another unfamiliar entertainment website should consider online safety before clicking through.
A trustworthy browsing experience should not require unnecessary software installations, suspicious browser extensions, or personal information unrelated to the service. Users should also avoid clicking misleading advertisements that imitate download buttons or system notifications.
Using established, legitimate streaming providers is generally the safer option. Official services are more likely to have clear policies concerning user accounts, payments, privacy, and content distribution.
Good digital habits are particularly important when searching for popular movies because high-demand entertainment terms can attract deceptive websites and misleading advertisements.
Pelisplus in the Broader Streaming Landscape
The story of Pelisplus is ultimately part of a much larger change in entertainment. Viewers have more choices than previous generations, while streaming companies compete for attention through original productions, licensed libraries, personalized recommendations, and regional programming.
Spanish-language entertainment has become an especially important part of this landscape. International audiences can now discover productions from countries and regions that were once difficult to access outside their original markets.
That global accessibility has also changed the way entertainment names travel across borders. A term that begins within one language community can quickly become recognizable to audiences elsewhere through search engines and social platforms.
Final Thoughts on Pelisplus
Pelisplus represents more than a simple movie-related search term. It reflects the larger transformation of entertainment discovery in the digital age. Audiences increasingly use search engines to find films, explore Spanish-language programming, compare viewing options, and keep track of changing streaming choices.
At the same time, familiarity should not be confused with verification. Anyone exploring an entertainment website should consider its legitimacy, privacy practices, security, and content licensing before using the service.
As online movie culture continues to evolve, names such as Pelisplus show how strongly search behavior, language, technology, and entertainment have become connected. What begins as a simple keyword can become part of a much wider conversation about how audiences discover and experience movies in the modern digital world.

Originality matters when you create academic, professional, or online content. You need to know if your writing contains wording that closely matches existing material.
A plagiarism checker can help you identify potential similarities. The tool compares your text against available sources and highlights matching sections.
However, you should understand what the results mean. A similarity match does not automatically prove plagiarism. You need to review the context and source before making changes.
What Is a Plagiarism Checker?
A plagiarism checker is a software tool that compares submitted text with other content. The comparison can include websites, publications, academic documents, and other indexed sources.
The system looks for similarities between your writing and material in its database. It can then highlight matching phrases or passages.
You can use the results during the editing process. The report can help you identify areas that may need better citations or stronger paraphrasing.
How Does a Plagiarism Checker Find Similar Text?
A plagiarism checker typically breaks your content into smaller sections. It then compares those sections against content available in its search or reference database.
The system can identify matching words and phrases. More advanced systems can also detect similarities in sentence structure or wording.
You may see several highlighted sections in a report. Each section can point to one or more possible sources.
The exact detection process depends on the tool. Different systems use different databases and comparison methods.
What Sources Can It Compare?
Source coverage depends on the plagiarism checker you use. Some tools focus heavily on online content. Others also provide access to academic papers, journals, and publications.
A tool with broader source coverage can provide more useful results for certain types of content.
Students may need academic sources for research papers. Website owners may care more about online articles and indexed pages.
You should therefore choose a tool that matches your content type.
How Does Text Matching Work?
Text matching can identify exact or closely related phrases. The system compares your submitted content with stored or indexed material.
For example, a sentence that appears word-for-word on another website may create an obvious match.
A paraphrased sentence may also produce a similarity result when the structure and wording remain close to the original.
You should review each match carefully. A report can identify similarity, but it cannot always determine why that similarity exists.
Can It Detect Paraphrased Content?
Some plagiarism detection systems can identify similarities beyond exact word matches. They may compare sentence structures and related wording.
You should not assume that changing a few words makes copied material original. Proper paraphrasing requires you to understand the source and express the idea in your own language.
A plagiarism checker can help identify passages that remain too close to their sources.
You should still cite the original source when you use another person’s ideas.
What Does a Similarity Score Mean?
A similarity score represents the amount of text that matches other sources according to the tool’s system.
You should not treat the score as a direct measure of plagiarism. Quotes, references, common phrases, and properly cited material can also create matches.
A plagiarism checker report becomes more useful when you examine individual results.
You should ask several questions. What source produced the match? Is the passage properly cited? Is the wording too close to the original?
The answers can help you decide what action to take.
How Are Matching Sources Shown?
Many tools provide a detailed report after checking your content. The report can highlight matching passages and identify possible sources.
You can use those details to compare your writing with the original material.
For example, you may find that a paragraph needs a citation. Another section may require better paraphrasing.
Clear source information can make the review process easier. You can quickly locate the original material instead of searching manually.
Can a Plagiarism Checker Detect Every Match?
No tool can guarantee that it will identify every possible similarity.
The result depends on the sources available to the system. Content that has not been indexed or included in its database may not appear in the results.
Different tools can therefore produce different similarity reports for the same document.
You should use the report as a review aid rather than treating it as an absolute measurement of originality.
How Should You Review a Similarity Report?
You should start by examining the highlighted passages. Then, check the sources connected to each match.
Next, decide why the similarity exists. You may have used a direct quotation, a common phrase, or information from a source.
You should add or correct citations when necessary. You can also rewrite passages that follow the original source too closely.
Finally, read the complete document again. Make sure the revised version remains clear and accurate.
Why Is Context Important?
A matching phrase does not always indicate improper copying. Academic writing often contains standard terminology and common expressions.
For example, a technical definition may use specific wording because the concept has an established meaning.
A plagiarism checker can identify the similarity, but you need to determine its significance.
You should therefore focus on the context of each match instead of changing every highlighted section automatically.
How Can You Reduce Unnecessary Similarity?
You can reduce accidental similarity by developing stronger writing habits. Start by understanding your sources before writing about them.
Take notes using your own words. Then write your explanation without copying the source sentence structure.
You should also cite ideas that come from other authors. Direct quotations should receive the appropriate quotation formatting and citation.
A plagiarism checker can help you review the final draft and find sections that still need attention.
Conclusion:
A plagiarism checker detects similar content by comparing your writing with sources available in its database. It can identify matching words, phrases, and sometimes similar sentence structures.
However, a similarity result does not automatically mean that plagiarism has occurred. You should examine each match and consider the source, context, citation, and wording.
You can use plagiarism detection as part of your editing process. Careful paraphrasing, proper citations, and original explanations can help you create stronger and more responsible content.
-

 BLOG1 year ago
hanime1: The Ultimate Destination for Anime Lovers
-

 Technology1 year ago
GLAADVoice.com: How You Can Get Involved and Make a Difference
-

 BILLS1 year ago
Why Does My Instagram Reel Stop Getting Views After One Hour? How to Fix It?
-
 ENTERTAINMENT1 year ago
Crackstreams 2.0: The Future of Free Sports Streaming?
-

 ENTERTAINMENT1 year ago
Sflix: How It’s Changing the Way We Watch Movies and TV Shows
-

 BLOG1 year ago
NHentai.nef: Understanding the Popular Hentai Archive
-

 BLOG1 year ago
ThisVid: What Makes It Stand Out in the World of Online Videos
-

 BLOG1 year ago
Imginn: The Ultimate Tool to View Instagram Content Anonymously